Rugby Test Match Odds: Identifying Variations Across Global Betting Platforms
Elena Richter · Jul 10, 2026
Rugby Test Match Odds: Identifying Variations Across Global Betting Platforms
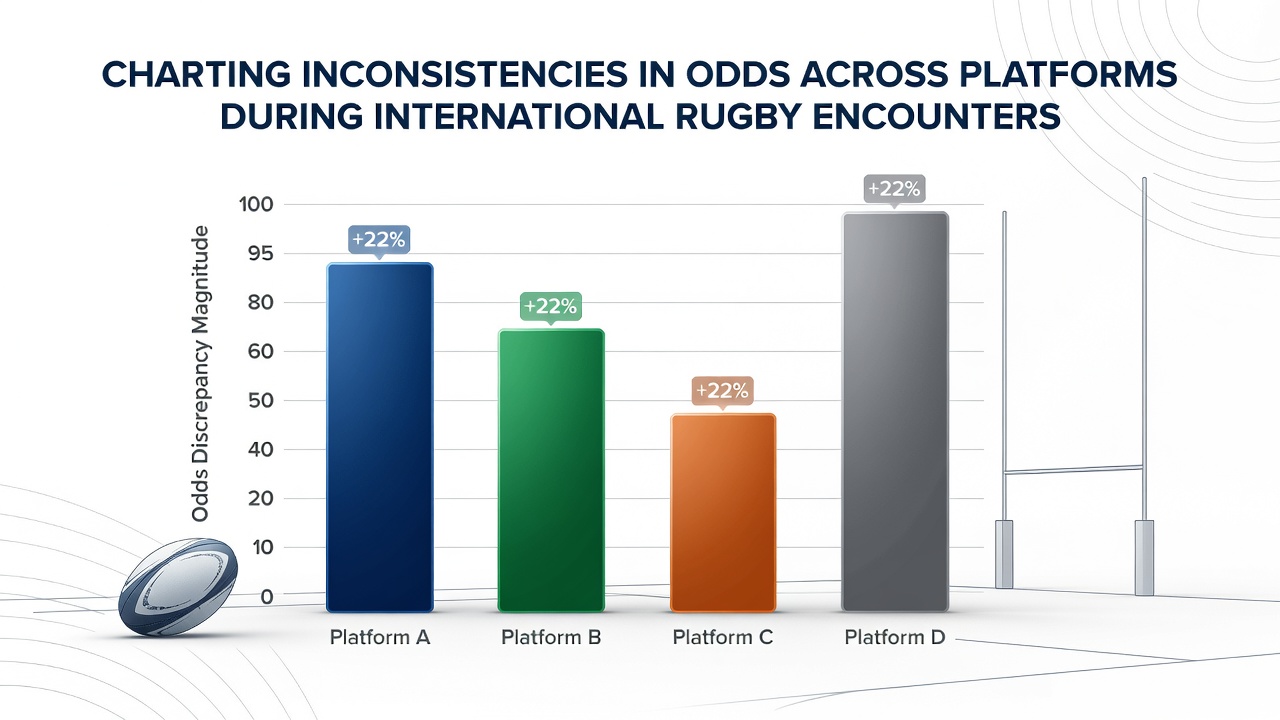
International rugby fixtures generate substantial betting activity, and observers note that odds for the same outcome often differ noticeably between platforms. These inconsistencies arise during events such as the Six Nations, Rugby Championship, and mid-year tours, where timing, market liquidity, and regional preferences influence pricing. Data from multiple fixtures in 2025 and early 2026 shows spreads that reach several percentage points on match-winner markets, creating opportunities for those monitoring multiple sites simultaneously.
How Platform Differences Emerge in Rugby Markets
Bookmakers adjust lines based on incoming wagers, injury reports, and weather updates, yet each operator applies its own risk models and customer profiles. One platform may price a favored side at 1.85 while another lists the identical selection at 1.92 because of differing liability thresholds. Exchanges add another layer, since peer-to-peer matching produces odds that fluctuate with every matched stake rather than with a central pricing engine. Researchers tracking these movements during the 2025 British and Irish Lions series recorded average discrepancies of 0.07 in decimal odds between the three largest exchanges and five major bookmakers over the opening weekend.
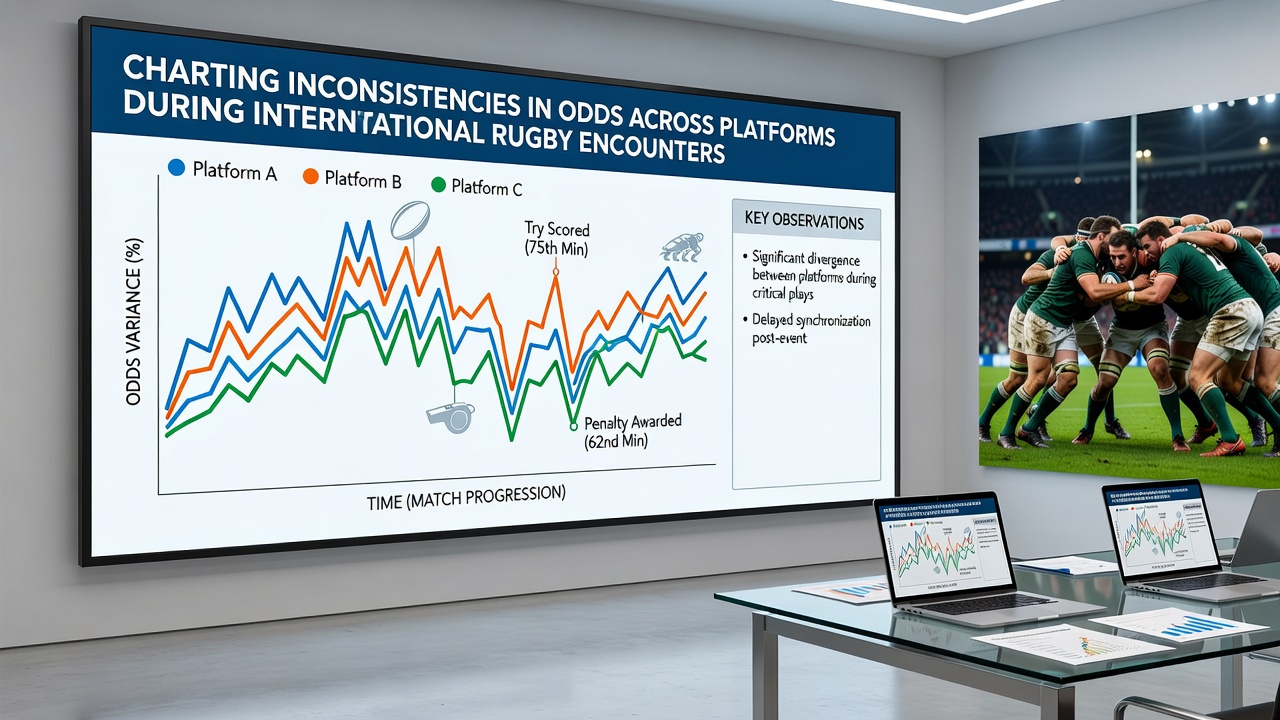
Live markets amplify the effect. When a try is scored or a card issued, platforms refresh prices at different speeds. Some operators integrate automated feeds that update within seconds, whereas others rely on manual review, producing brief windows where the same selection carries mismatched values. Observers monitoring the July 2025 Australia versus South Africa test series documented instances in which one site still offered 2.10 on a +7.5 handicap after three competing platforms had already shifted the line to 1.95.
Regional and Regulatory Influences on Pricing
Geographic licensing requirements shape how operators set margins. Platforms licensed in jurisdictions with strict consumer-protection rules often carry higher built-in margins than those operating under lighter frameworks, which contributes to cross-border price gaps. According to figures published by the Alcohol and Gaming Commission of Ontario, Canadian-regulated operators displayed average overrounds 1.8 percentage points higher than certain offshore sites during the 2025 Rugby World Cup pool stage. Meanwhile, data compiled by the Australian Institute of Family Studies shows that domestic bookmakers in that country maintained tighter margins on popular rugby markets compared with international competitors, partly because of local competition and tax structures.
Examples from Recent Fixtures
Take the November 2025 England versus New Zealand encounter at Twickenham. Pre-match win odds for teh All Blacks ranged from 2.35 on one exchange to 2.48 on a European bookmaker and 2.41 on an Asian platform. The 0.13 spread translated into an implied probability difference of roughly 2.3 percent. During the second half, when England took the lead, live handicap odds diverged further as some operators reacted faster to the scoreline change.
Similar patterns appeared in the July 2026 New Zealand tour of South Africa. Early-week match-winner markets for the first test showed a 0.09 decimal spread between the two largest exchanges and three prominent bookmakers. By kickoff the gap narrowed but never disappeared entirely, illustrating how volume and hedging activity compress yet do not eliminate inconsistencies.
Tools and Methods for Tracking Discrepancies
Specialized comparison services aggregate prices from dozens of platforms and present them in unified dashboards. These services refresh at intervals ranging from five seconds to one minute, allowing users to spot temporary misalignments. Some platforms also supply historical odds archives, which researchers use to quantify average spreads across entire tournaments. A 2024 study from the University of Sydney examined over 1,200 rugby internationals and found that average pre-match discrepancies exceeded 3 percent in decimal odds for 38 percent of matches, with the largest gaps occurring on handicap and total-points markets.
Automated alerts notify subscribers when a monitored selection crosses a user-defined threshold. During the 2026 mid-year tests, such systems flagged several instances in which live underdog lines moved more than 0.15 within a single minute across competing sites, prompting rapid position adjustments before the discrepancy corrected itself.
Market Liquidity and Its Role
High-profile fixtures attract greater liquidity, which tends to reduce but not erase price differences. Lower-profile matches, such as mid-week tours or Pacific Nations Cup games, often display wider spreads because fewer participants and slower information flow allow operators more latitude in pricing. Data from the 2025 Pacific Nations Cup showed average spreads 47 percent larger than those recorded during concurrent Six Nations weekends.
Conclusion
Odds inconsistencies across platforms remain a measurable feature of international rugby betting markets. Systematic monitoring reveals recurring patterns tied to timing, liquidity, regional regulation, and platform-specific risk management. Continued collection of cross-platform data provides a factual basis for understanding how these variations develop and persist throughout major rugby encounters.